")
Data exfiltration is a common data theft technique and most feared cyber-attack. it is a data breach that happens when a company’s or an individual’s data is copied, retrieved, or transferred from a system.
Detection of data exfiltration is quite difficult because to adequately block download/upload of data to malicious applications without restricting access to applications that users need. The possible way to detect and block data exfiltration is to actively monitor network flow with effective methods. Possible methods of virtual data exfiltration can be one the following.
| HTTP/HTTPS Uploads | Instant Messaging |
| FTP | Cloud Storage Uploads |
| SSH | Steganography |
| VPN | Timing Channel |
| Protocol tunneling | P2P filesharing |
Here, I am going to demonstrate one of the methods to monitor data exfiltration using PCR presented at FloCon 2014 by Carter Bullard of QoSient and John Gerth of Stanford University on Elastic Stack.
PCR is an interesting mathematical function because it gives a better indication of network patterns by ignoring complicated details such as the number of bytes sent/received, number of events & packets transferred, etc.
The idea here is to track the PCR for each host over time to identify significant changes that might indicate possible data exfiltration.
Producer-Consumer Ratio: A normalized value indicating directionality of application information transfer, independent of data load or rate. PCR is calculated on a per-host basis, as follows.
PCR = (bytes sent – bytes received) / (bytes sent + bytes received)
This mathematical function breaks down the network flow to one simple number in the range [-1 to 0 to 1]. Researchers have also provided the following sample values to interpret the PCR for some common applications in the presentation.
| PCR | Host Role |
| 1 | pure push – FTP upload, multicast, beaconing |
| 0.4 | 70:30 export – Sending Email |
| 0 | Balanced Exchange – NTP, ARP probe |
| -0.5 | 3:1 import – HTTP Browsing |
| -1 | pure pull – HTTP Download |
One can detect possible data exfiltration by comparing a host’s baseline PCR to its current PCR to identify compelling shifts. To accomplished this, I have created a dashboard on Kibana to monitor the PCR metric on a perimeter firewall (Palo Alto) on one of our clients.
Exfiltration will be from an internal network to outside – internet. I have filtered allowed outbound events by considering the zones, device action, sent bytes, and received bytes.
Kibana’s special math aggregation in a visual builder is used to compute PCR and markdown visuals for the reference table. The following screenshot shows the dashboard overview.
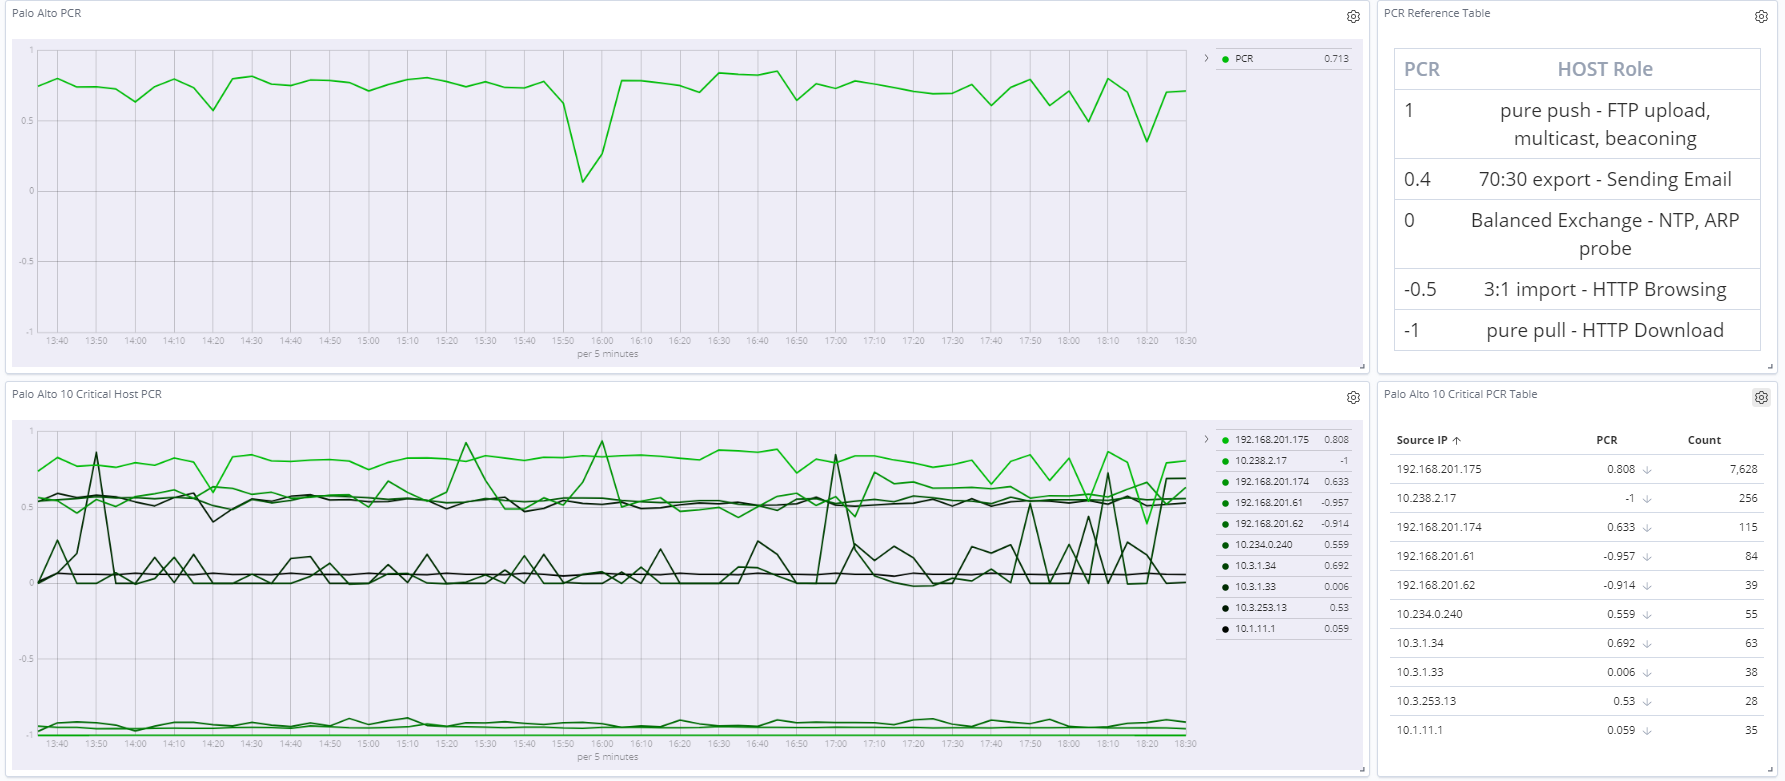
The following four visualizations have been created. we will drill down visualization for more details.
| # | Name | Description |
| 1 | Palo Alto PCR | Indicating an overall view of log source |
| 2 | Palo Alto 10 Critical Host PCR | Timeline graph of 10 critical hosts |
| 3 | Palo Alto 10 Critical PCR Table | Table depicting PCR of hosts with event count |
| 4 | PCR Reference Table | Reference table for PCR values |
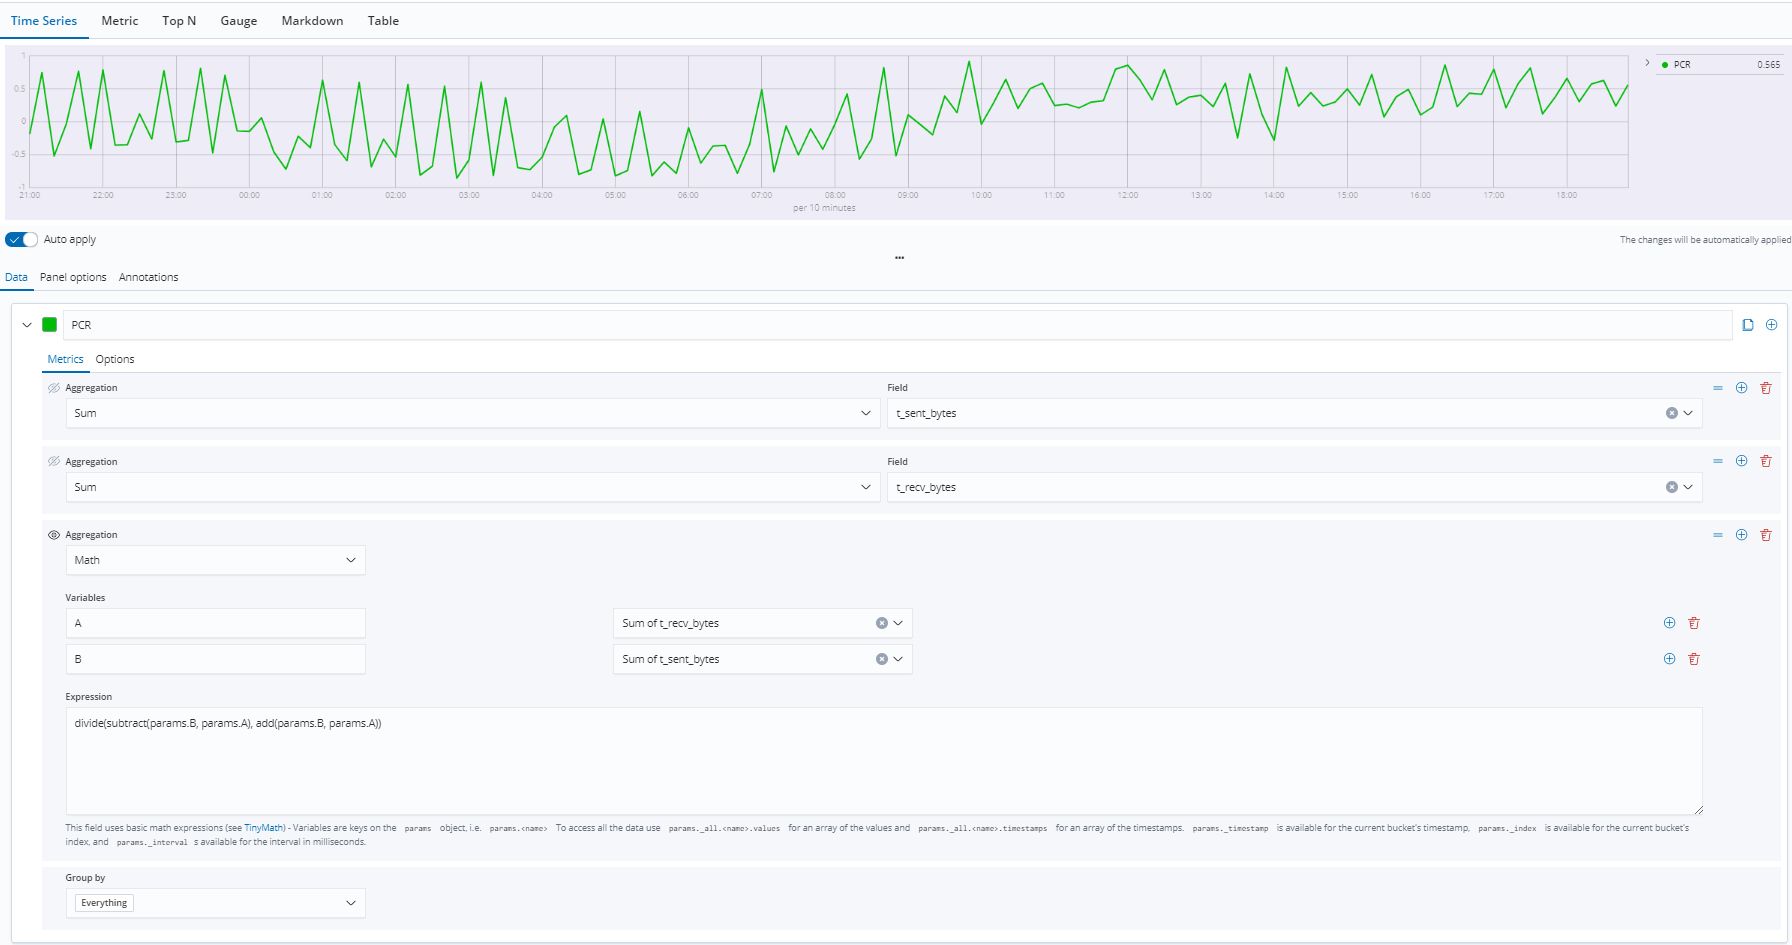
I have used sum aggregation on send and received bytes to calculate PCR by expression in math aggregation as shown in the following screenshot.
Expression divide(subtract(params.B, params.A), add(params.B, params.A))
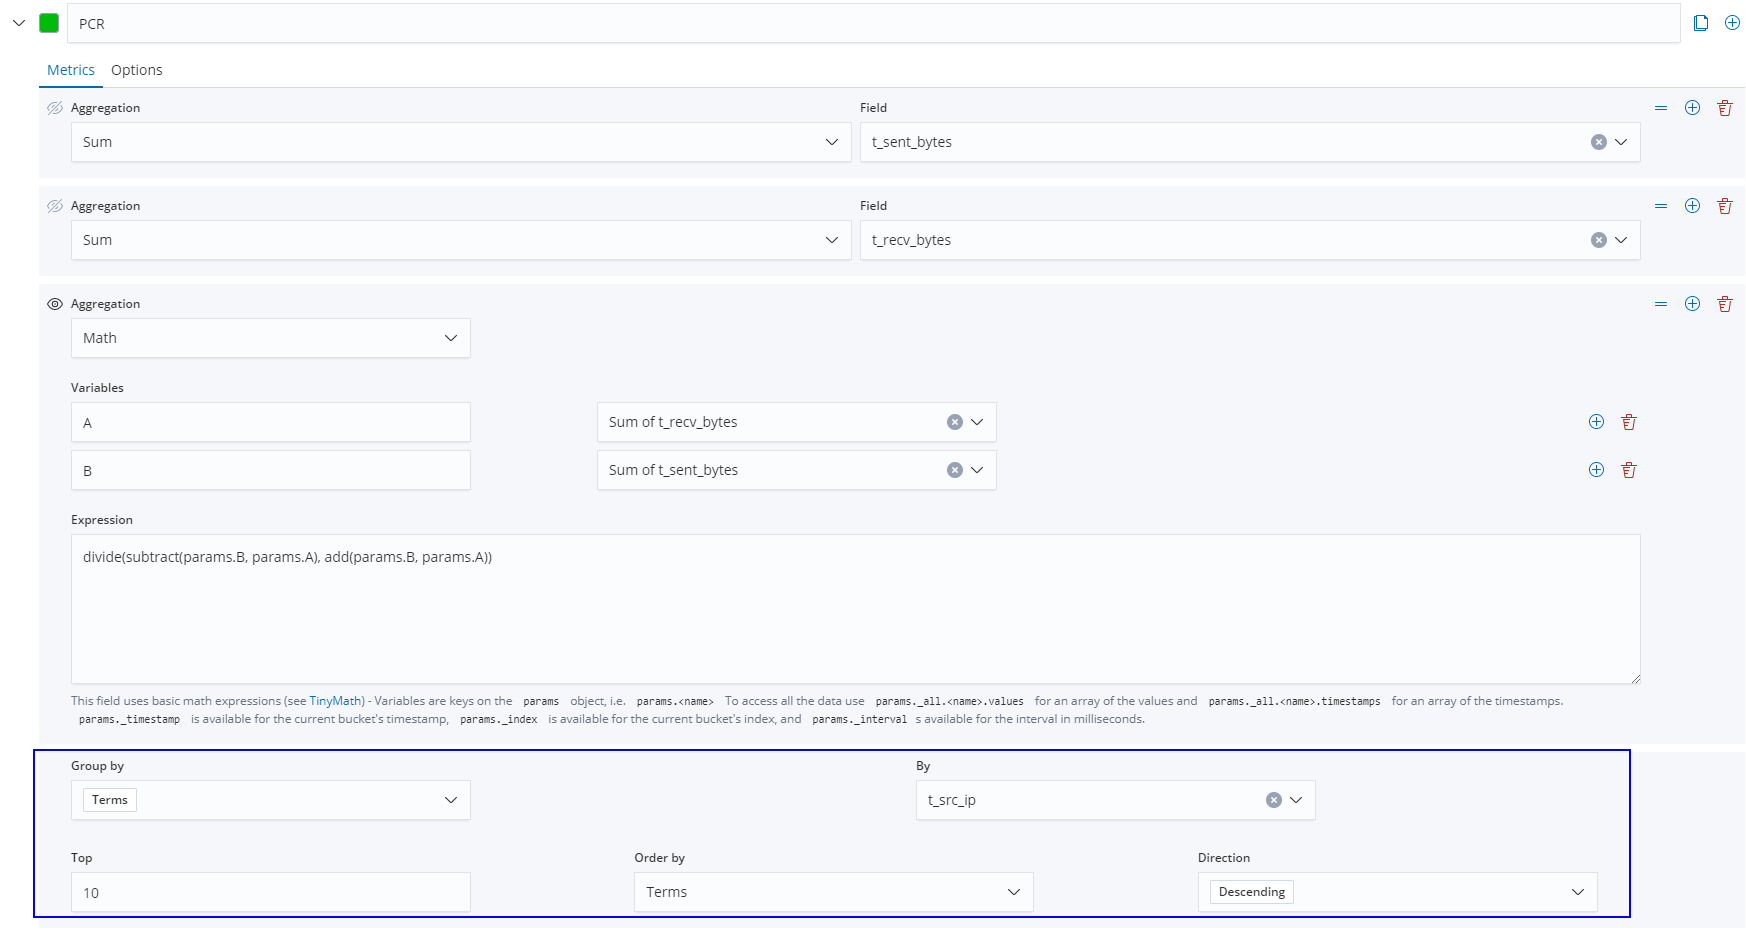
Second Visual – “Palo Alto 10 Critical Host PCR” is the same as above, the only difference is here grouping is done on source IP as shown in the following screenshot and 10 critical servers are whitelisted in a filter to be monitored.
In “Palo Alto 10 Critical PCR Table”, the visual builder table is used with the same PCR metric used in previous visuals and an additional count metric as shown in the following screenshot.

Actively monitoring dashboard can result into fruitful anomaly detection, I have observed spikes of around 0.9 PCR in one of the critical servers, which led to the intense investigation as shown in the following screenshot.
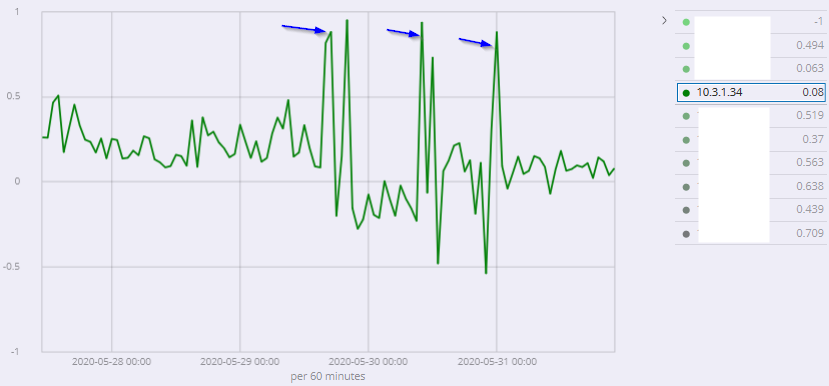
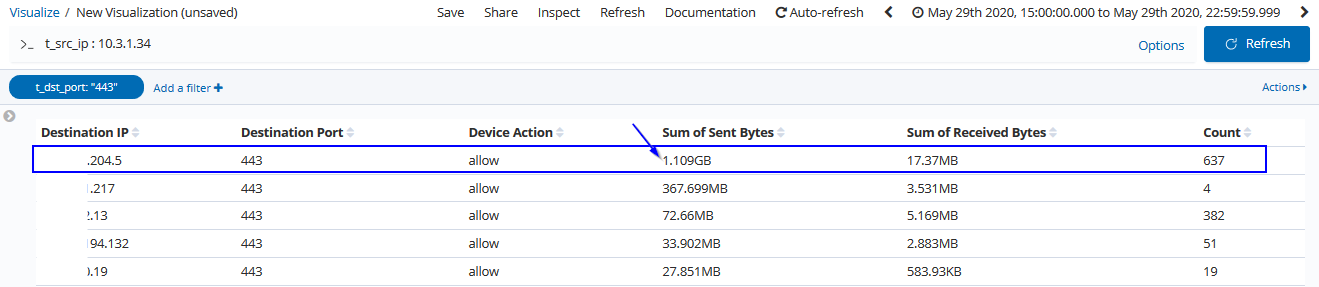
On further investigating the events of the first two spikes, there were HTTPS uploads of 1.109 GB to unknown IP address as shown in the following screenshot.
We can conclude that change in trend graph needs attention, requires investigation, and further drill down, which might help in detecting data exfiltration from critical servers.
Note: Detection of exfiltration using PCR will be challenging when an attacker uploads 10000 bytes and download 10000 bytes. In this case, PCR will zero but the probability of exfiltration in this fashion will be less.
Network Intelligence provides threat hunting services using its BlueScope platform built on top of the Elastic Stack.
References
http://detect-respond.blogspot.com/2016/09/detecting-data-staging-exfil-using-PCR-shift.html
https://resources.sei.cmu.edu/asset_files/Presentation/2014_017_001_90063.pdf
https://digitalguardian.com/blog/what-data-exfiltration
https://en.wikipedia.org/wiki/Data_exfiltration
For more blogs click here
4