Introduction
Cuckoo Sandbox is an Open Source Automated Malware Analysis system that has been gaining more and more attention in recent years. The fact that Cuckoo is fully open source makes it a very interesting system for those that want to modify its internals, experiment with automated malware analysis, and setup scalable and cheap malware analysis clusters. [1]
Malware is the raw-material associated with many cybercrime-related activities. Cuckoo is a lightweight solution that performs automated dynamic analysis of provided Windows binaries. It is able to return comprehensive reports on key API calls and network activity.
Cuckoobox was originally developed as part of GSoC 2010 by Claudio Guarnieri and has been greatly enhanced in subsequent GSoCs under Claudio’s leadership. [2] There were other few GSoCs involved in the initial development phase.
Cuckoo Sandbox
Cuckoo is an open source automated malware analysis system.
It’s used to automatically run and analyse files and collect comprehensive analysis results that outline what the malware does while running inside an isolated Windows operating system.
It can retrieve the following type of results:
- Traces of win32 API calls performed by all processes spawned by the malware.
- Files being created, deleted and downloaded by the malware during its execution.
- Memory dumps of the malware processes.
- Network traffic trace in PCAP format.
- Screenshots of Windows desktop taken during the execution of the malware.
- Full memory dumps of the machines.
Cuckoo is designed to be used both as a standalone application as well as to be integrated in larger frameworks, thanks to its extremely modular design.
It can be used to analyse:
- Generic Windows executables
- DLL files
- PDF documents
- Microsoft Office documents
- URLs and HTML files
- PHP scripts
- CPL files
- Visual Basic (VB) scripts
- ZIP files
- Java JAR
- Python files
- Almost anything else
Thanks to its modularity and powerful scripting capabilities, there’s not limit to what you can achieve with Cuckoo. [3]
As a short history, v0.1a was released in August, 2010, v0.1 was released in January 2011, and v1.1 was released in somewhere around Q2 2014. The version consists of a 0day (Indirect Remote Code Execution) in the function os.path.join() which can be exploited by passing second parameter as “/etc/passwd” instead of “etc/passwd”. This leads to path change to “/etc/passwd” rather than concatenating “etc/passwd” to the first parameter. This vulnerability was fixed in v1.1.1 which was released in late 2014. It is also been patched in the upcoming v1.2 of Cuckoo Sandbox.
Note: Cuckoo Sandbox requires Python 2.7+ but NOT Python 3.x
Prerequisite
Following are the basic and mandatory prerequisite for Cuckoo Sandbox
- Basic Linux Knowledge
- Basic Knowledge of Virtual Machines
- Knowledge to leverage the results
- Windows API
- Malicious Behaviours
An addition knowledge of Python would be of great help for:
- Customization
- Module creation
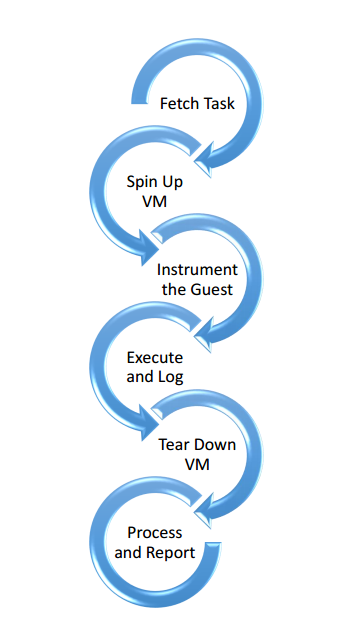
Working Process of Cuckoo
Why Cuckoo Sandbox?
- It’s free
- It’s open source
- Everything is a module
- Everything is automated
- Custom scripts can be written
- Can perform concurrent analysis
How to start Cuckoo Sandbox?
To get your hands dirty with Cuckoo sandbox, follow the below mentioned steps:
- Install VMWare / Oracle Virtual Box / QEMU / KVM
- Download and extract Cuckoo
- Install all the dependencies. The list of dependencies is available at http://docs.cuckoosandbox.org/en/latest/installation/host/requirements/#installing-python-libraries
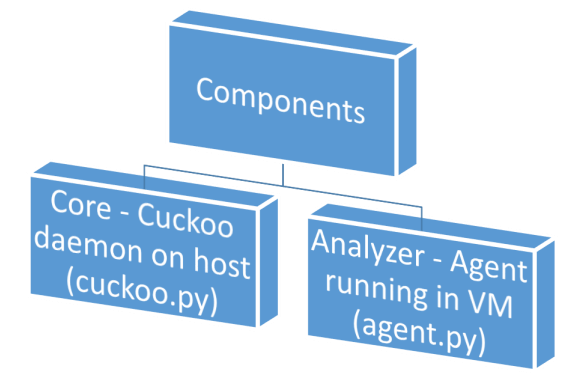
- Create VM, Copy and Run agent.py, and take snapshot
- Configure the files in “conf/”
- Run “python cuckoo.py”
What is the output?
The report contains the following output from the dynamic analysis performed by executing the malware on the VM.
- Traces to API Calls
- File dumps
- IoC (Indicators of Compromise)
- Signatures
- Screenshots
- Network Traffic (pcap file)
- Process memory dump
- System memory dump
These memory dumps can be analysed using volatility [4].
Raw Results
The raw results for the analysis are stored at “storage/analysis/<ID>”.
Reports
The reports are generated and stored at “storage/analysis/<ID>/reports”. Usually the reports are generated in following format:
- JSON
- HTML
- MAEC
- MongoDB
We can also create custom reporting modules to meet the needs.
Reference
- http://nullcon.net/website/goa-15/speakers/jurriaan-bremer.php
- http://www.honeynet.org/project/Cuckoo
- http://docs.cuckoosandbox.org/en/latest/introduction/what/
- http://www.volatilityfoundation.org/
A CISC, CHFIv8 certified forensic investigator. Sumit Shrivastava has started his career as a Security Analyst Intern in Network Intelligence (I) Pvt. Ltd., Mumbai. Also working on on-going projects with the company for more than over a year with the professional tools for investigation, audit and VAPT.
Beautifully explained for a layman to understand